JP1/Performance Management monitors and collects information about the different parts of your system,
helping you run it smoothly. JP1 can be used in both on-premises and cloud environments to efficiently
monitor different kinds of nodes without the use of specialized monitoring tools. With JP1's diverse
functions, you can evaluate your system's relative performance, by comparing, along a timeline, your
system's operating status against accumulated operational data. This makes it easier to identify areas
that are likely to become future bottlenecks and allows you to perform capacity planning without relying
on instinct alone.
Key Features
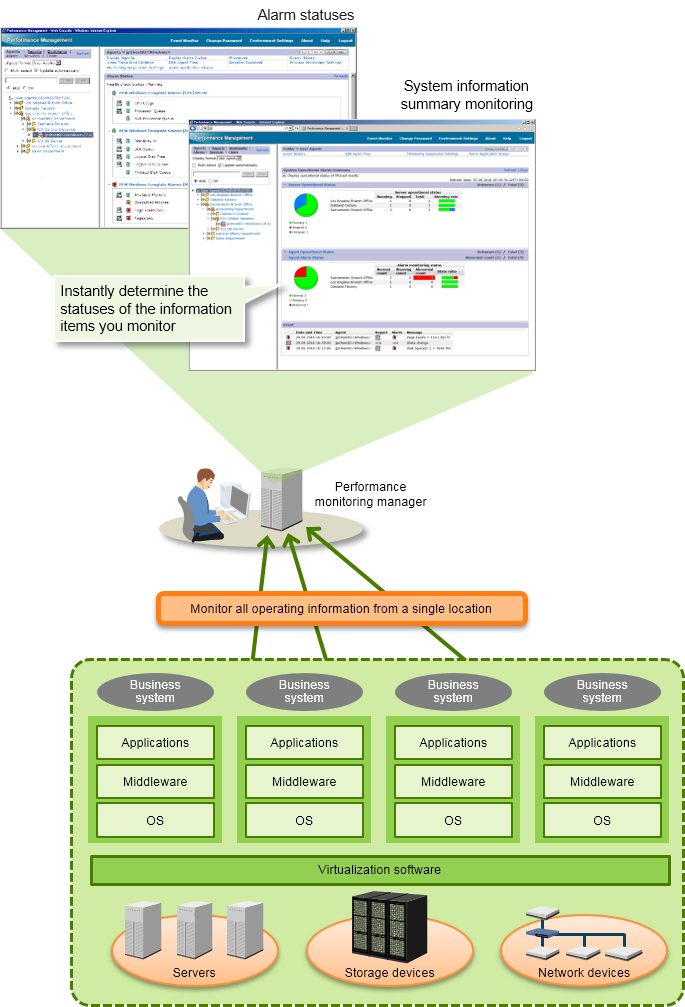
A full system overview is available in a single window, making it easy for you to see how
well your system is operating. The overview includes information such as the number of running servers
and agents, the number of stopped servers and agents, and the ratio of the first to the latter. You
can also view the number of alarms (warnings) generated.
Agentless monitoring
Agentless monitoring allows you to monitor servers without installing agents. This is an effective
solution when you want to introduce JP1 products into an existing system and start monitoring them
immediately.
<Agentless monitoring features>
The installation of agent software is not required
Allows you to monitor without interrupting the existing systems
Monitors servers without increasing the servers load
Agent-based monitoring
Agent-based monitoring involves installing agent software on the servers. This type of monitoring
provides more detailed information about the operating status of the servers.
<Agent-based monitoring features>
Agent software installation is required
Continuously monitors the servers even if the servers are not connected to the
network
Enables greater control over how servers are monitored
JP1 offers several useful templates, that notify administrators if critical or
warning-level thresholds are reached. These templates help you monitor your assets immediately. You
can customize them for better integration with your system.
Use the icons in the Quick Guide window to easily perform actions such as configuring the monitoring
settings and displaying reports. By assigning a keyword (for example, "CPU", "memory", or "TCP"), you
can easily find and select the information you want to monitor.
i. Assign a keyword (for example, "CPU", "memory", or "TCP") to easily search for the related
information you want to monitor.
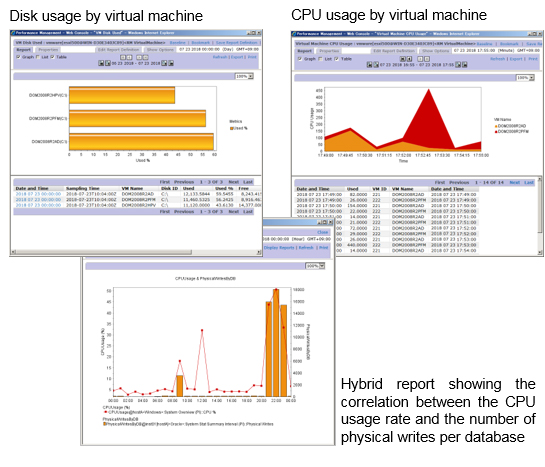
Create and view reports in various formats, using bar graphs, broken line graphs, lists,
tables, and more. You can also overlap them to create hybrid reports, which are useful especially
during data analysis or determining the correlations and trends emerging from different sets of data.
It is a constant challenge for the system to continue accumulating and managing operational data, as
well as making effective use of this ever-increasing volume of data. JP1 can help by automatically
aggregating your data by the minute, hour, day, week, month, or year. This aggregation of data allows
you to assess how your system has changed over time, eliminating the reliance on guesswork during
capacity planning. By specifying the amount of time for which the aggregated data is to be retained,
you can strike a balance between continuous monitoring and the amount of disk space occupied by
records.
Monitoring targets and the main types
of information that can be monitored
Monitoring target
Main types of information that can be monitored
Windows
CPU usage, memory usage, disk usage, disk access status, network usage, detailed
information for each process, number of processes, device information, service information, event
log information, etc.
Information related to Active Directory: number of connected client sessions, number of
Windows updates that have not been applied, Active Directory replication traffic, etc
Linux, AIX, Solaris, HP-UX
CPU usage, memory usage, disk usage, disk access status, information about the
users running each program, process operating status, status of system resources
used by each process, amount of data transferred over the network, network usage,
network collisions, etc.
Rate and amount of CPU usage by physical server or virtual machine; CPU shortage rate; maximum,
minimum, and equilibrium values for CPU allocation;
amount of used memory; swap space I/O; working set size; working set size ratio; maximum and
minimum values for memory allocation; amount of unused memory;
amount of allocated memory; amount of used swap space; rate at which disk commands are discarded;
usage rate and amount for each logical disk;
disk space used by the data store; speeds at which data is sent and received over the network;
etc.
Monitoring target
Main types of information that can be monitored
Oracle Database
CPU usage, memory usage, I/O cache hit ratio, sorting information, detailed information for each
process, database usage rate, tablespace information,
fragmentation, lock occurrence information, SQL information, error information, parameter
information, information about ASM disk groups, etc.
Microsoft SQL Server
Status of the space used by the database, cache hit rate, network usage, environment settings
information, lock occurrence information, error information,
number of scans, number of compilations, physical I/O volume, usage status of transaction logs,
job execution statuses, etc.
HiRDB
Buffer information (number of actual I/O operations, hit rate, etc.), information about locked
resources, network-related information of servers
and clients, status of the space used by the database, status of the space used by the HiRDB file
system, HiRDB server information, etc.
Monitoring target
Main types of information that can be monitored
SAP ERP, SAP S/4HANA, SAP BW/4HANA
Response time, dispatcher wait time, database request time, number of dialog steps, SAP memory
usage rate, SAP buffer hit rate,
number of logged-in users, operating statuses of work processes, system log information, CCMS
alerts, etc.
Monitoring target
Main types of information that can be monitored
Other types of performance information
Other types of performance information that can be defined and imported into JP1 for monitoring